
Gold standard OEE — what is behind it?
Gold standard OEE (Overall Equipment Efficiency is sometimes the ultimate manufacturing standard for measuring the productivity of machines, processes, and devices. Used as a KPI (Key Performance Indicator) OEE is decisive for production controlling, as it makes it possible to determine the performance of machines considering the influencing factors of availability, quality and efficiency. This means that the OEE provides feedback on productivity over a specific period and the influencing factors provide information on where improvements can be made.
- Availability: Proportion of the total time in which the machine is available for production. This factor considers all downtimes — planned and unplanned shutdowns, malfunctions, production breaks and other causes.
- Quality: Determines the good parts produced in the first run, which do not require rework with additional effort, or which do not have to be ruled out as bad parts.
- Performance: Speed or cycle time at which the machine is operated. Short shutdowns and slow cycle times are included. Machine wear, inferior materials, incorrect material feed and material jams affect performance. The prerequisite for the correct calculation is an accurate record of the cycle time.
How real-time data sustainably increases productivity
Collecting and contextualizing machine data in real time and automatically calculating the OEE has the following advantages over manual recording by the operator:
- Lower error rate and higher accuracy
- Reliable and cost-effective recording
- Immediate further processing of data for correlation and analysis to derive optimization measures
- Increased productivity through time savings and visible responsibility
Using OEE figures correctly
Multiplying the three influencing factors availability x quality x speed gives the Overall Equipment Efficiency (OEE).
- 100% — The ideal situation. Production runs perfectly, has no downtime and produces the highest quality products.
- 85% — A world-class value. Many manufacturers strive to attain this over the long term for production. Values that are higher often omit planned downtimes.
- 60% — A fair value. Production has room for improvement.
- 40% — Entry-level value for beginners. Common productivity levels among companies that do not yet record OEE or are just starting to do so.
What Overall Equipment Efficiency can do and what are its limits
The relevance of the OEE is undisputed. Comparisons are useful when systems and machines of the same type are involved. Especially when the same product is being manufactured using the same production process. Recording periods that are too short, e.g. on an hourly, daily or shift basis, can reduce or even distort the significance of the OEE, as production peaks or failures have too much influence and not enough data has been collected during the period. Longer periods of time on a monthly or quarterly basis provide a smoother record with more meaningful data for determining the OEE production KPI and identifying potential for improvement. But this is exactly where the crux of the KPI lies. It describes what happens over a period and is therefore a mere snapshot. The OEE should therefore not be considered alone, because it is only in combination with the influencing factors of quality, performance and availability that it is possible to determine where the causes of the existing weak points lie. It is also easier to implement measures and to change individual parameters and to comprehensively classify their effects.
Although many production processes are now fully automated, there are always sub-processes that are carried out manually by operators, skilled workers and tool owners that accompany the automated sections for reasons of safety or complexity. However, there should be no blind spots here: a complete recording of the entire production process is required. This can be remedied by so-called worker terminals, which can be used to manually record the status of the machine, alarms and throughput in digital form. In addition, these specialists usually have a strong understanding of systems that goes so far that they can hear or even “feel” if the machine state deviates from the norm. This domain knowledge is essential for implementing improvement measures. Early involvement of the entire production team, starting with the data collection stage, is therefore crucial for successful implementation. That is because solid results depend on the motivation of everyone involved. In addition, optimization measures and required goals can be achieved more efficiently and effectively through active participation in problem solving by cross-functional teams and their wide range of know-how.
That is why it makes sense that machine manufacturers want individual OEE
In business administration, there is a warning against comparing apples with pears, and the same caution is required in connection with the OEE. Despite the widespread use of this KPI, it is not recommended to use the same OEE calculation across machines, locations or industries. Why? Because the conditions and requirements of the production process cannot be more different from machine to machine, from location to location and from industry to industry in mechanical engineering. Instead, this requires a great deal of experience and an individual orientation of KPIs for each company. But at the same time, this does not mean glossing over the OEE values for presentation to management because they would prefer to see 100% instead of the realistic 85%, but instead, continuing to focus on the indication of potential.
Industry-specific metrics — an approach
One option not to start completely from scratch is to use industry-specific KPI models. Two common KPI models are the SEMI E10 standard for the semiconductor industry and the VDI 3432 guideline for mechanical engineering. Their OEE calculations takes into account specific machine states and uses other KPI terms.
SEMI E10 standard: The SEMI E10 standard specifies the definition and measurement of reliability, accessibility and maintainability of devices (RAM). The standard defines six different machine states: Productive Time, Standby Time, Engineering Time, Scheduled Time, Unscheduled Time, Non-Scheduled Time.
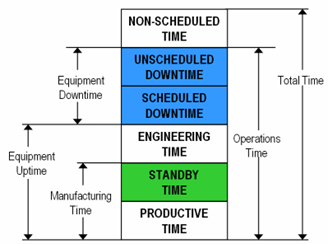
Figure 1: The six machine states according to the SEMI E10 standard
For example, the OEE calculation in accordance with SEMI E10 consists of the following factors
OEE = availability (AV) x efficiency (UU) x process output (PP) x yield (YLD)
The terms described above are explained once again below and supplemented by the degree of utilization:
- Availability (AV): Availability shows how good the maintenance status and reliability of the machine is. The conditions planned downtime (SDT) and unplanned downtime (UDT) are evaluated based on the ratio of time that can be used for production to total time. The better the maintenance team looks after the machine and optimizes these tasks, the higher the AV.
- Utilization rate (UU): The utilization rate evaluates the time used for production with the total usable time. This determines how well production is organized, considering standby and engineering times. The more time is spent in production, the better the UU are. Logistical problems such as material supply and availability of operating personnel lead to a reduction in the level of utilization.
- Process performance (PP): Process performance determines the speed of the machine by comparing the quantity achieved with the theoretically possible number of units produced. The faster the machine produces, the higher the PP. A value of greater than 100% is not possible, as the maximum theoretical speed cannot be exceeded.
- Yield (YLD): The yield defines the ratio of saleable (good) parts to all manufactured parts and is therefore an expression of the product quality achieved. If no waste is produced, the YLD can reach a maximum of 100%.
VDI 3432 Guideline: The VDI 3423 guideline is defined by the Association of German Engineers. This model evaluates machines from the perspective of production and the responsibilities organized there. Standardization allows a comparison of very different machines in terms of efficiency, warranty claims and to support investment decisions. The guideline distinguishes between individual machines and components and considers the five machine states Utilization Time, Organizational Time, Technical Downtime, Maintenance Time and Test Time.
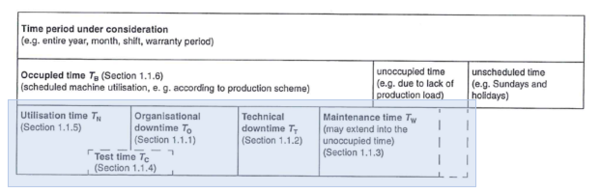
Figure 2: The five machine states in accordance with the VDI 3432 guideline, VDI Handbuch, 2002, S.5
According to the VDI 3432 guideline, the following parameters influence the OEE:
- The occupancy time TB is the time that is scheduled for the machine. It is the reference time for the standard’s other parameters.
- The organizational failure rate Ao indicates the failure rate because of organizational deficiencies in terms of occupancy time.
- The technical failure rate TT indicates the failure rate due to technical defects in relation to the occupancy period.
- The maintenance-related failure rate AW indicates the failure rate as a result of planned maintenance measures.
- The utilization rate NG indicates the ratio of time used for production in relation to occupancy time and is therefore a measure of effectiveness.
- The technical availability VT indicates the proportion of the occupancy time for which the machine was available for production without technical defects.
If the standard OEE KPI or these industry-specific standards are not enough, or if there is a need for individual characteristics, then dynamic KPIs could be the right answer.
Focus on maximum flexibility and high comparability with dynamic KPIs
Dynamic KPIs are relevant both for machine manufacturers who have different machines and systems in their product range that cannot be evaluated using standardized KPI models, and operators s who want to evaluate their production according to specific KPIs. At the same time, however, the manufacturer would like to retain the option of continuing to compare machines of one type, one customer or one region at any time and to be able to flexibly switch between different KPI models and different OEE calculations.
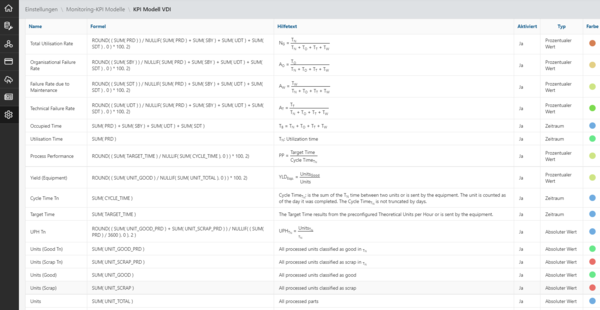
Figure 3: Formula editor — KPI model according to VDI 3432 guideline
In the EquipmentCloud® IIoT service solution, a formula editor was implemented in the monitoring module, which makes it possible to use the industry specific KPIs as templates, and also to define your own models and assign them to individual or multiple machines.
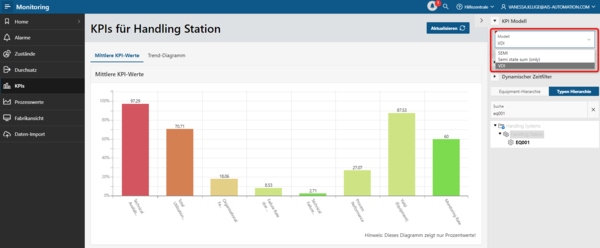
Figure 4: Drop-down menu KPI models for cross-machine and cross-hierarchy comparisons
A practical drop-down menu in the KPI view allows the user to quickly switch between KPI models to open the possibility of comparing machines across multiple locations.
Would you like to find out more? Then make a demo appointment with our experts now to see how dynamic KPIs can significantly improve OEE in real time.

{{comment.comment}}